In project I, we are given two dataset(only data without any additional message and use basic machine learning technique) for regression and classification.
This notes is to mark down some of the detail of the project for reference
In both of the dataset, there are (x_train, y_train) pair and x_test which is left for us to make prediction. Both of the x_train in two dataset are in high dimension(71 and 37 respectively). We need to perform data analysis, feature processing and model selection on the dataset. Also noticed that we are not provided any description on the data, ie, the data do not have any semantic meaning for us.
regression
data description:
x_train: 2800x71 dimension, ie, 2800 samples in 71 dimension
y_train: 2800x1
x_test: 1200x71, ie there are 1200 input for the predition
classification
data description:
x_train: 1500x37 dimension
y_train: 1500 binary {-1,1}
x_test: 800x37
comment:
- projectI 做完的感觉的就是,数据在手里的时候,很多theory的东西都fail了.比如说degree增大的时候lambda反而更小了,test error不是永远比train error小的。 bias variance analysis感觉用来解释error分布还是说得通的。但是lambda就很说不通…lambda的取值不太稳定感觉还是有点tricky.
- 这次的regression和classification都用了model split的方法,都是有一两个feature分布很典型,regression里用到了先做classification分成三个model再做regression的方法,error从500+一直降到了个位数。开心得晚上差点就通宵了。
- dummy encoding用在两个dataset上面都是没什么效果。就是feature selection这种东西真的是很难有通用的方法啊。实践出真知,不同dataset用的方法不同。
- machine learning的modelz在用的时候一定要记得assumption. fit the assumption can be another way to improve the model. for example logistic regression假设是input is gaussian分布的但是实际上input可以很极端很skew。所以处理数据的时候可以采用让data尽量高斯的方法(like boxcox)这一次就是…在feature transformation的时候很愚蠢的问了句为什么要让他高斯啊…啊真的是…然后output为什么不能使-1 1要是0和1..就是 要动脑啊
- data visulization也是很重要,这一次两个model的split都是看出来的。当然看的方法也很重要,like
1
2scatter(y_train,X_train(:,i)) //就可以很好的看出两者关系(当然很可能是看不出关系的)
histogram(X_train(:,i),60) //view the distribution of features
刚开始看的方法不好结果就是看了一天都没有看出什么来
- 要放弃暴力调参多动脑…开始的时候暴力了一天都没有很大提升然后一直很upset后来跟着师姐才开始慢慢摸着路,总之就是不能只看最后出来的那个结果,得到的数据还是要plot出来分析一下原因
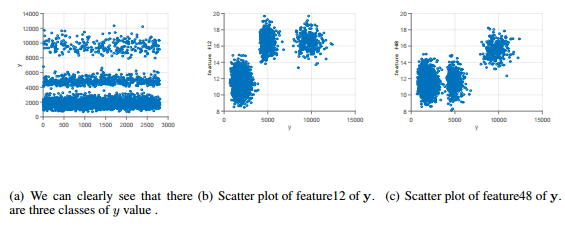
- 贴一下分model的图,for regression, it is obviously that the value of feature 12 and feature48 is related to output value. for classification, the value of feature 35 is not related to output value obviously but it is shown that there are two model(we can interprete as dataset collected for two group of people/area…something like that)
- 还有就是师姐太厉害了要在这里膜拜一下!
Below is what I planned to do at the beginning of the project.
Later I found things do not happen as what I expect.. So just keep it as .. histogry.
I found the most important things should be:
First apply simple model.
Then really look at the data plot! such as histogram and scatter
Exploratory data analysis: to learn about the characteristics of the data.
To have a general idea of the data, there are several things we can do:
1) try to plot the data to view the distribution of the data
2) try to use linear regression to fit the dataset(it is better to choose with the simplest approach as the start point)
3) base on what we find on step1 and step2, it is time to perform some feature processing on the dataset,
4) test on different models, it can be: a. linear regression with basis function expansion(polynormial is one the most simplest one, it can also be some special function such as sigmoid, sin, cos, exp and so on). b. as the complexity of the model increase, overfitting may arise, so we may consider perform regulization on the model, ie, try to penalize the weights, in this case, we can try ridge regression which use l2 regulization. (Notice that we can also use l1 regulization, however, according to what I read, people said that l2 is more stable then l1 while l1 can penalized the weights of the unuseful features to zero significantlt which may be helpful for us to figure the relation or information the features. However I have not look into the detail and proof yet, just mentioned here for future reference)
5) for the regulazation part, cross validation can be perform for parameters choice. another information cross validation can provide is the stability of our model, ie, if the performance/test error/train error have large variance on different cross fold, it may means the models are not that stable(my guess…), since that the performance is highly depend on the training data we choose. (overfitting with high variance? not sure) and
6)ie, estimate the true test error by decomposite it into bias + variance part. and model comparision
Feature processing: cleaning your input and ouput variables, i.e. rescaling, transformation, removing outliers etc.
Applying methods and visualizing.
least square - regression without penelizedworked or not worked reason? what is beta, what beta shows us? the weight?ridge regression - how to choose lambda
corss-validation- Determining whether a method overfits or underfits.
- Cross-validation to estimate test errors.